Monitoring PostgreSQL activity
Monitoring PostgreSQL activity with pg_stat_activity.
PostgreSQL is incredibly powerful, but like any database, it needs occasional monitoring to stay healthy. One of the simplest and most useful tools for this is the built-in view pg_stat_activity.
What Is pg_stat_activity?
It is a system view that shows real-time information about every current connection to your PostgreSQL server.
Run this command in psql:
SELECT * FROM pg_stat_activity;
You’ll get a list of rows, one for each active backend process.
Let’s take a quick look at the output.
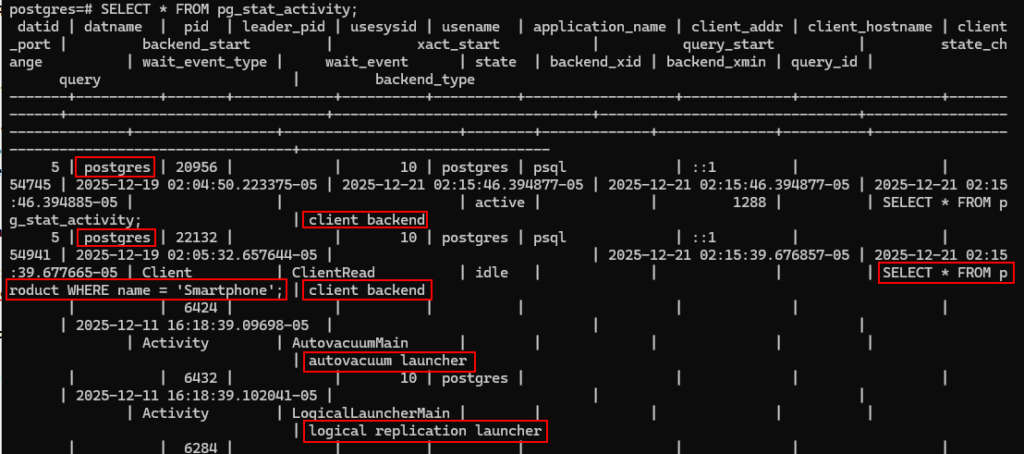
On a quiet local laptop (like mine), it only returns 9 rows, even if I only have two psql windows open.
Don’t panic, that’s completely normal!
Why are there so many rows?
PostgreSQL runs several background processes automatically to keep the database running smoothly:
Autovacuum launcher & workers: clean up dead rows (prevents table bloat).
Background writer: writes dirty data to disk.
Checkpointer: creates checkpoints for crash recovery.
Walwriter: writes to the write-ahead log (WAL).
Stats collector: gathers performance statistics (only in older versions).
Logical replication workers: (if enabled).
Plus your own connections:
Each open psql session.
Any idle connections.
Connections from tools like pgAdmin or DBeaver.
Let’s show them.
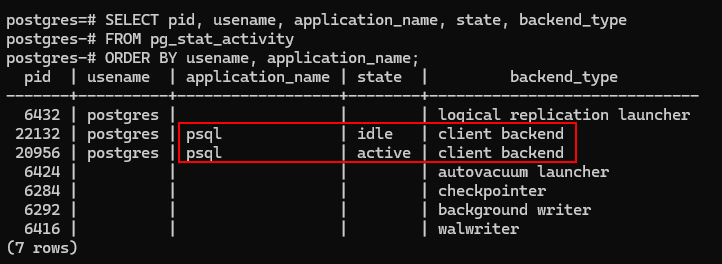
SELECT pid, usename, application_name, state, backend_type
FROM pg_stat_activity
ORDER BY usename, application_name;
Why monitor pg_stat_activity?
The main reason I check it regularly is to spot long-running or idle transactions, these are the biggest cause of table bloat and performance problems.
But I also use it for two other important checks:
1.
Unusual Logins / Security Scans.
Look at the columns usename, client_addr, client_hostname, and application_name.
On my local laptop, everything should come from ::1 or 127.0.0.1 (localhost) and application_name = ‘psql’.
If you ever see:
An unknown username.
A remote IP address (on a server).
Strange application_name (e.g., weird scripts or tools).
That could be a sign of unauthorized access or brute-force attempts.
2.
See what queries are running right now.
The query column shows the current or last executed query for each session.
Great for:
Debugging slow performance (what’s taking so long?)
Seeing what a stuck application is doing
Long-running or idle transactions.
These can cause serious problems:
They keep old row versions alive → prevent VACUUM from cleaning up → table and index bloat.
Bloat → slower queries, bigger database, wasted disk space.
In extreme cases → performance degradation or even out-of-disk errors.
As I explained in my snapshots post, long transactions block cleanup.
(https://safecomputer.org/postgresql-snapshots/)
Useful queries to make It manageable.
The full SELECT * is overwhelming (queries can be long), so here are filtered versions I use
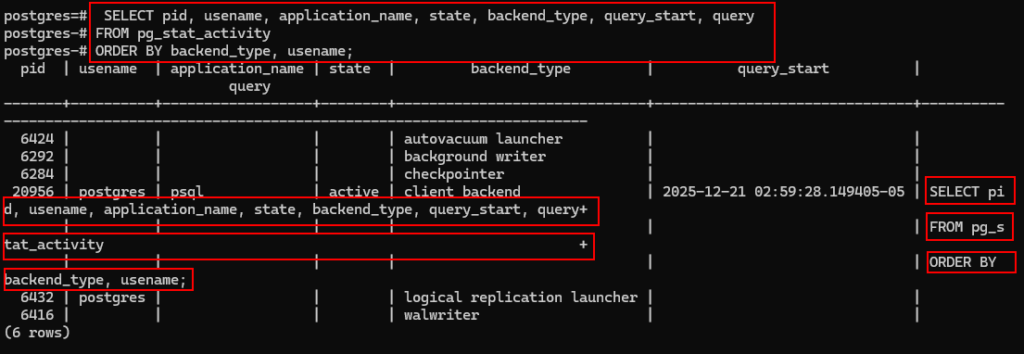
Simple overview with backend type.
SELECT pid, usename, application_name, state, backend_type, query_start, query
FROM pg_stat_activity
ORDER BY backend_type, usename;
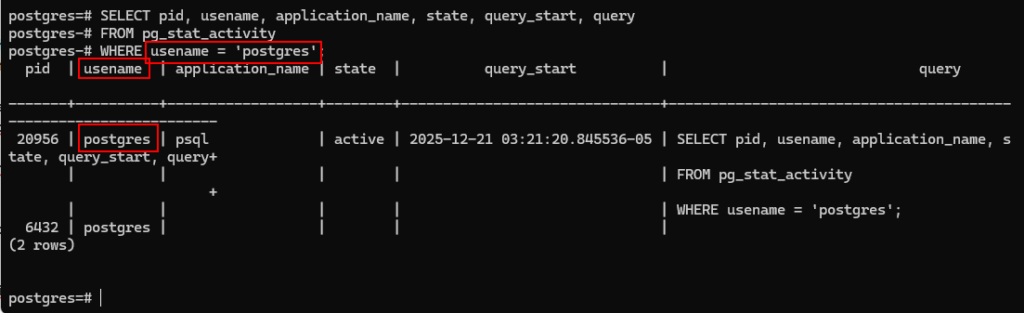
Or display just your own sessions
SELECT pid, usename, application_name, state, query_start, query
FROM pg_stat_activity
WHERE usename = ‘postgres’; — Replace with your actual user name
This can be useful if you log in from multiple systems.
I used this a lot to keep an eye on my own sessions on other workstations.
Find Long-running or idle transactions
SELECT pid, usename, application_name, now() – query_start AS duration, state, query
FROM pg_stat_activity
WHERE state = ‘active’
OR state = ‘idle in transaction’
ORDER BY duration DESC;
This shows how long each query/transaction has been running.
If you see something idle for hours or days, that’s a red flag!
What if you find a long running query, and you want to kill it?
Kill a problem transaction
SELECT pg_terminate_backend(pid)
FROM pg_stat_activity
WHERE pid = 1234; — Replace with the actual PID
Use carefully, it kills the session immediately.
My routine
I run the long-running query above every week on my development databases. It only takes seconds and has saved me from bloat many times.
Summary
pg_stat_activity is your window into what’s happening inside PostgreSQL right now.
Use it to understand normal background activity
Use it to spot dangerous long transactions
Keep your database lean and fast
Try the queries on your own PostgreSQL, you’ll be surprised what you find!
If you have a favorite monitoring query, share it in the comments.
This brings us to the end of my post on Monitoring PostgreSQL activity.
Thank you for taking the time to read my post on Monitoring PostgreSQL activity.
I hope you found it enjoyable and insightful.
Stay tuned for more content that is coming soon.
If you like what you read, please consider sharing it with others who might find it helpful.
Contact me
If you have any questions or want to contact me, please drop me an email at info@safecomputer.org
Stay updated with my monthly newsletter
Subscribe to Safe Computer’s monthly newsletter in the right sidebar for tips on job applications, cybersecurity, and more! Get summaries of my latest posts, like this Database Crimes, straight to your inbox. Join now at safecomputer.org!
Disclaimer
All tips and methods mentioned in this blog are tested on Windows 11. Please note that results may vary on other operating systems or versions of Windows. Adapt the instructions accordingly.
Copyright
© 2025 Henny Staas/safecomputer.org. Unauthorized use and/or duplication of this material without express and written permission from this site’s author and/or owner is strictly prohibited. Excerpts and links may be used, provided that full and clear credit is given to Henny Staas/safecomputer.org with appropriate and specific direction to the original content.